Visualization 1: Principles

The Purpose of Data Visualization

datasaurus_dozen
dataset x y
0 dino 55.384600 97.179500
1 dino 51.538500 96.025600
2 dino 46.153800 94.487200
3 dino 42.820500 91.410300
4 dino 40.769200 88.333300
... ... ... ...
1841 wide_lines 33.674442 26.090490
1842 wide_lines 75.627255 37.128752
1843 wide_lines 40.610125 89.136240
1844 wide_lines 39.114366 96.481751
1845 wide_lines 34.583829 89.588902

1846 rows × 3 columns

datasaurus_dozen.groupby("dataset").size()
dataset
away          142
bullseye      142
circle        142
dino          142
dots          142
h_lines       142
high_lines    142
slant_down    142
slant_up      142
star          142
v_lines       142
wide_lines    142
x_shape       142
dtype: int64

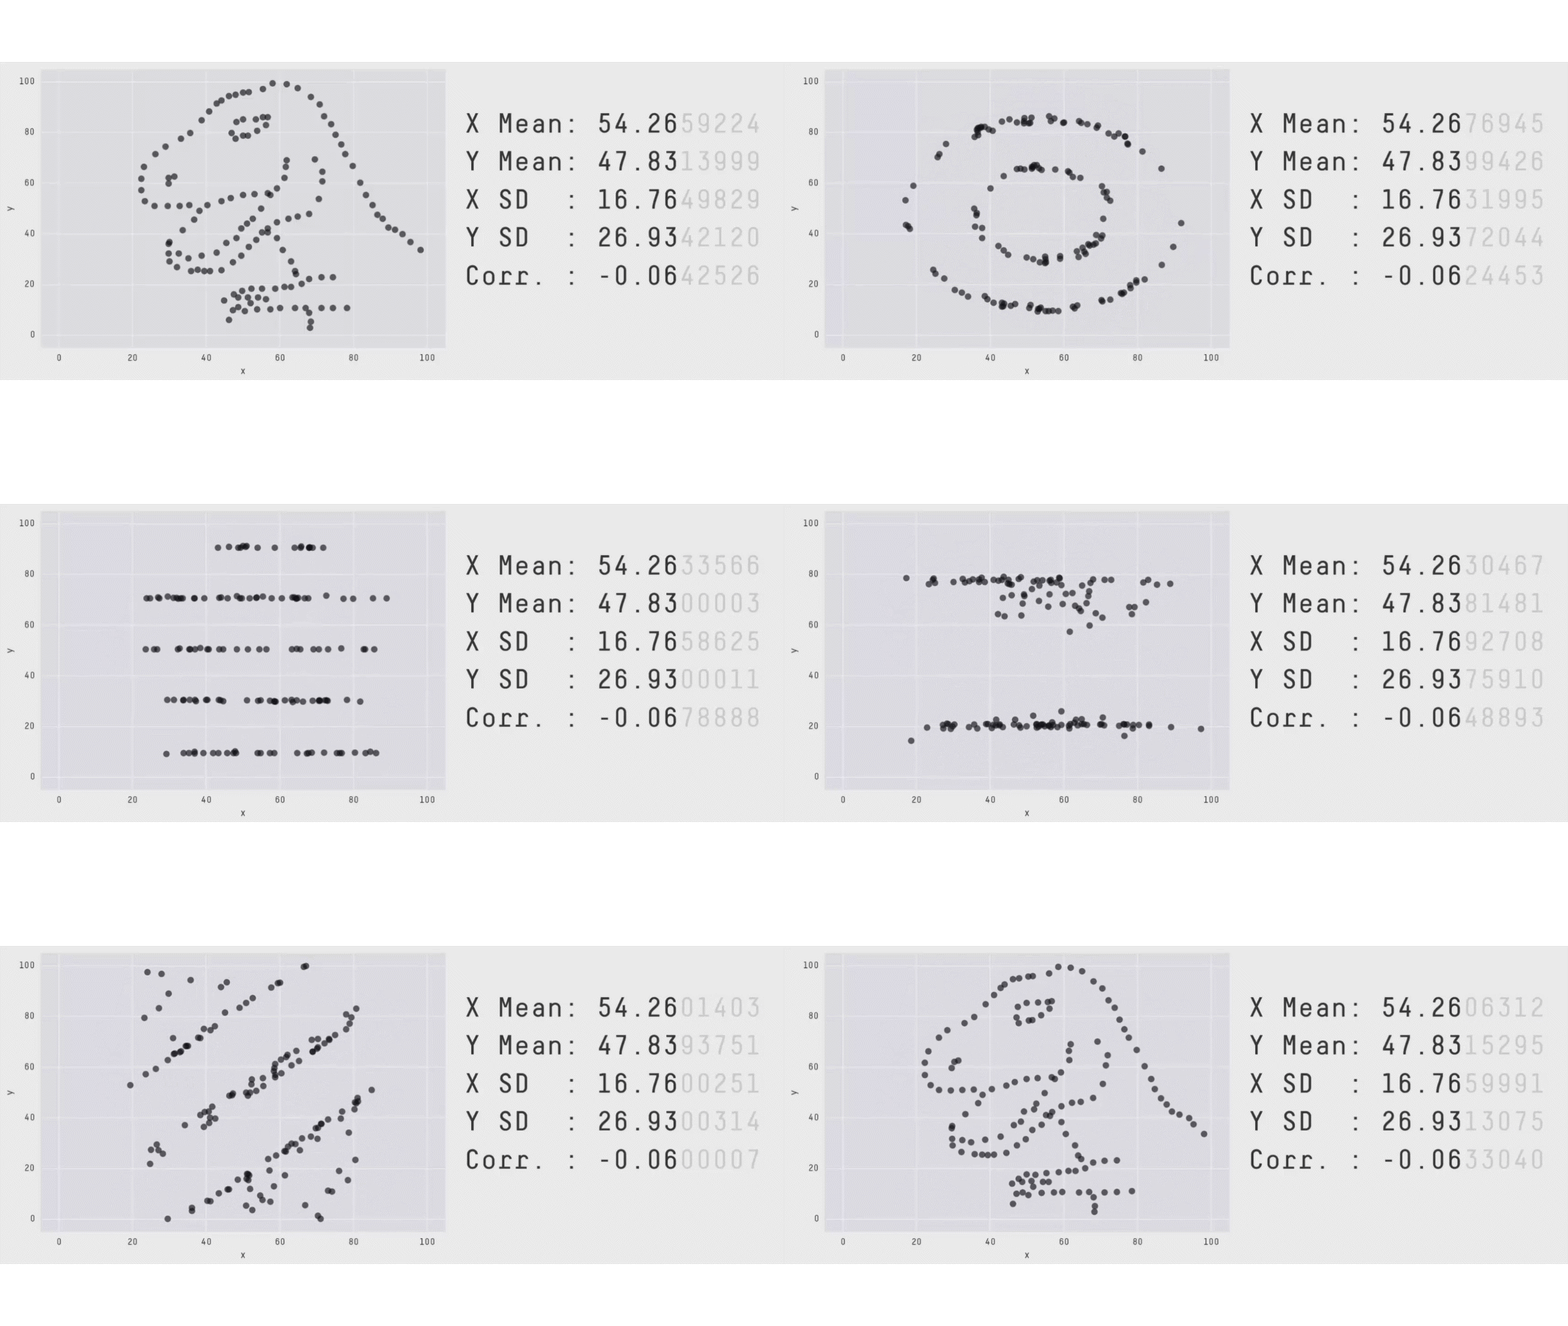
Let’s look at summary statistics

selected_datasets = datasaurus_dozen[datasaurus_dozen['dataset'].isin(["away", "bullseye", "dots", "star", "dino"])]
selected_datasets.groupby("dataset").mean()
x y
dataset
away 54.266100 47.834721
bullseye 54.268730 47.830823
dino 54.263273 47.832253
dots 54.260303 47.839829
star 54.267341 47.839545

Visualize

px.scatter(selected_datasets, x="x", y="y", facet_col="dataset", 
           width=1000, height=300)

The Foundations of Data Visualization

Data Visualization uses visual representations to help data scientists discover and present patterns in data. It takes advantage of the well-developed human visual system.

Designing an effective visualization requires that we determine:

  • The purpose of the visualization by identifying:
    • the key question
    • the context
  • The most appropriate visual composition using:
    • The structure of our data (e.g., types of variables)
    • How the human visual system works (e.g., visual cues)

Summary: Novartis Graphics Principles Cheat Sheet

Exploratory Data Analysis (EDA)

Exploratory Data Analysis

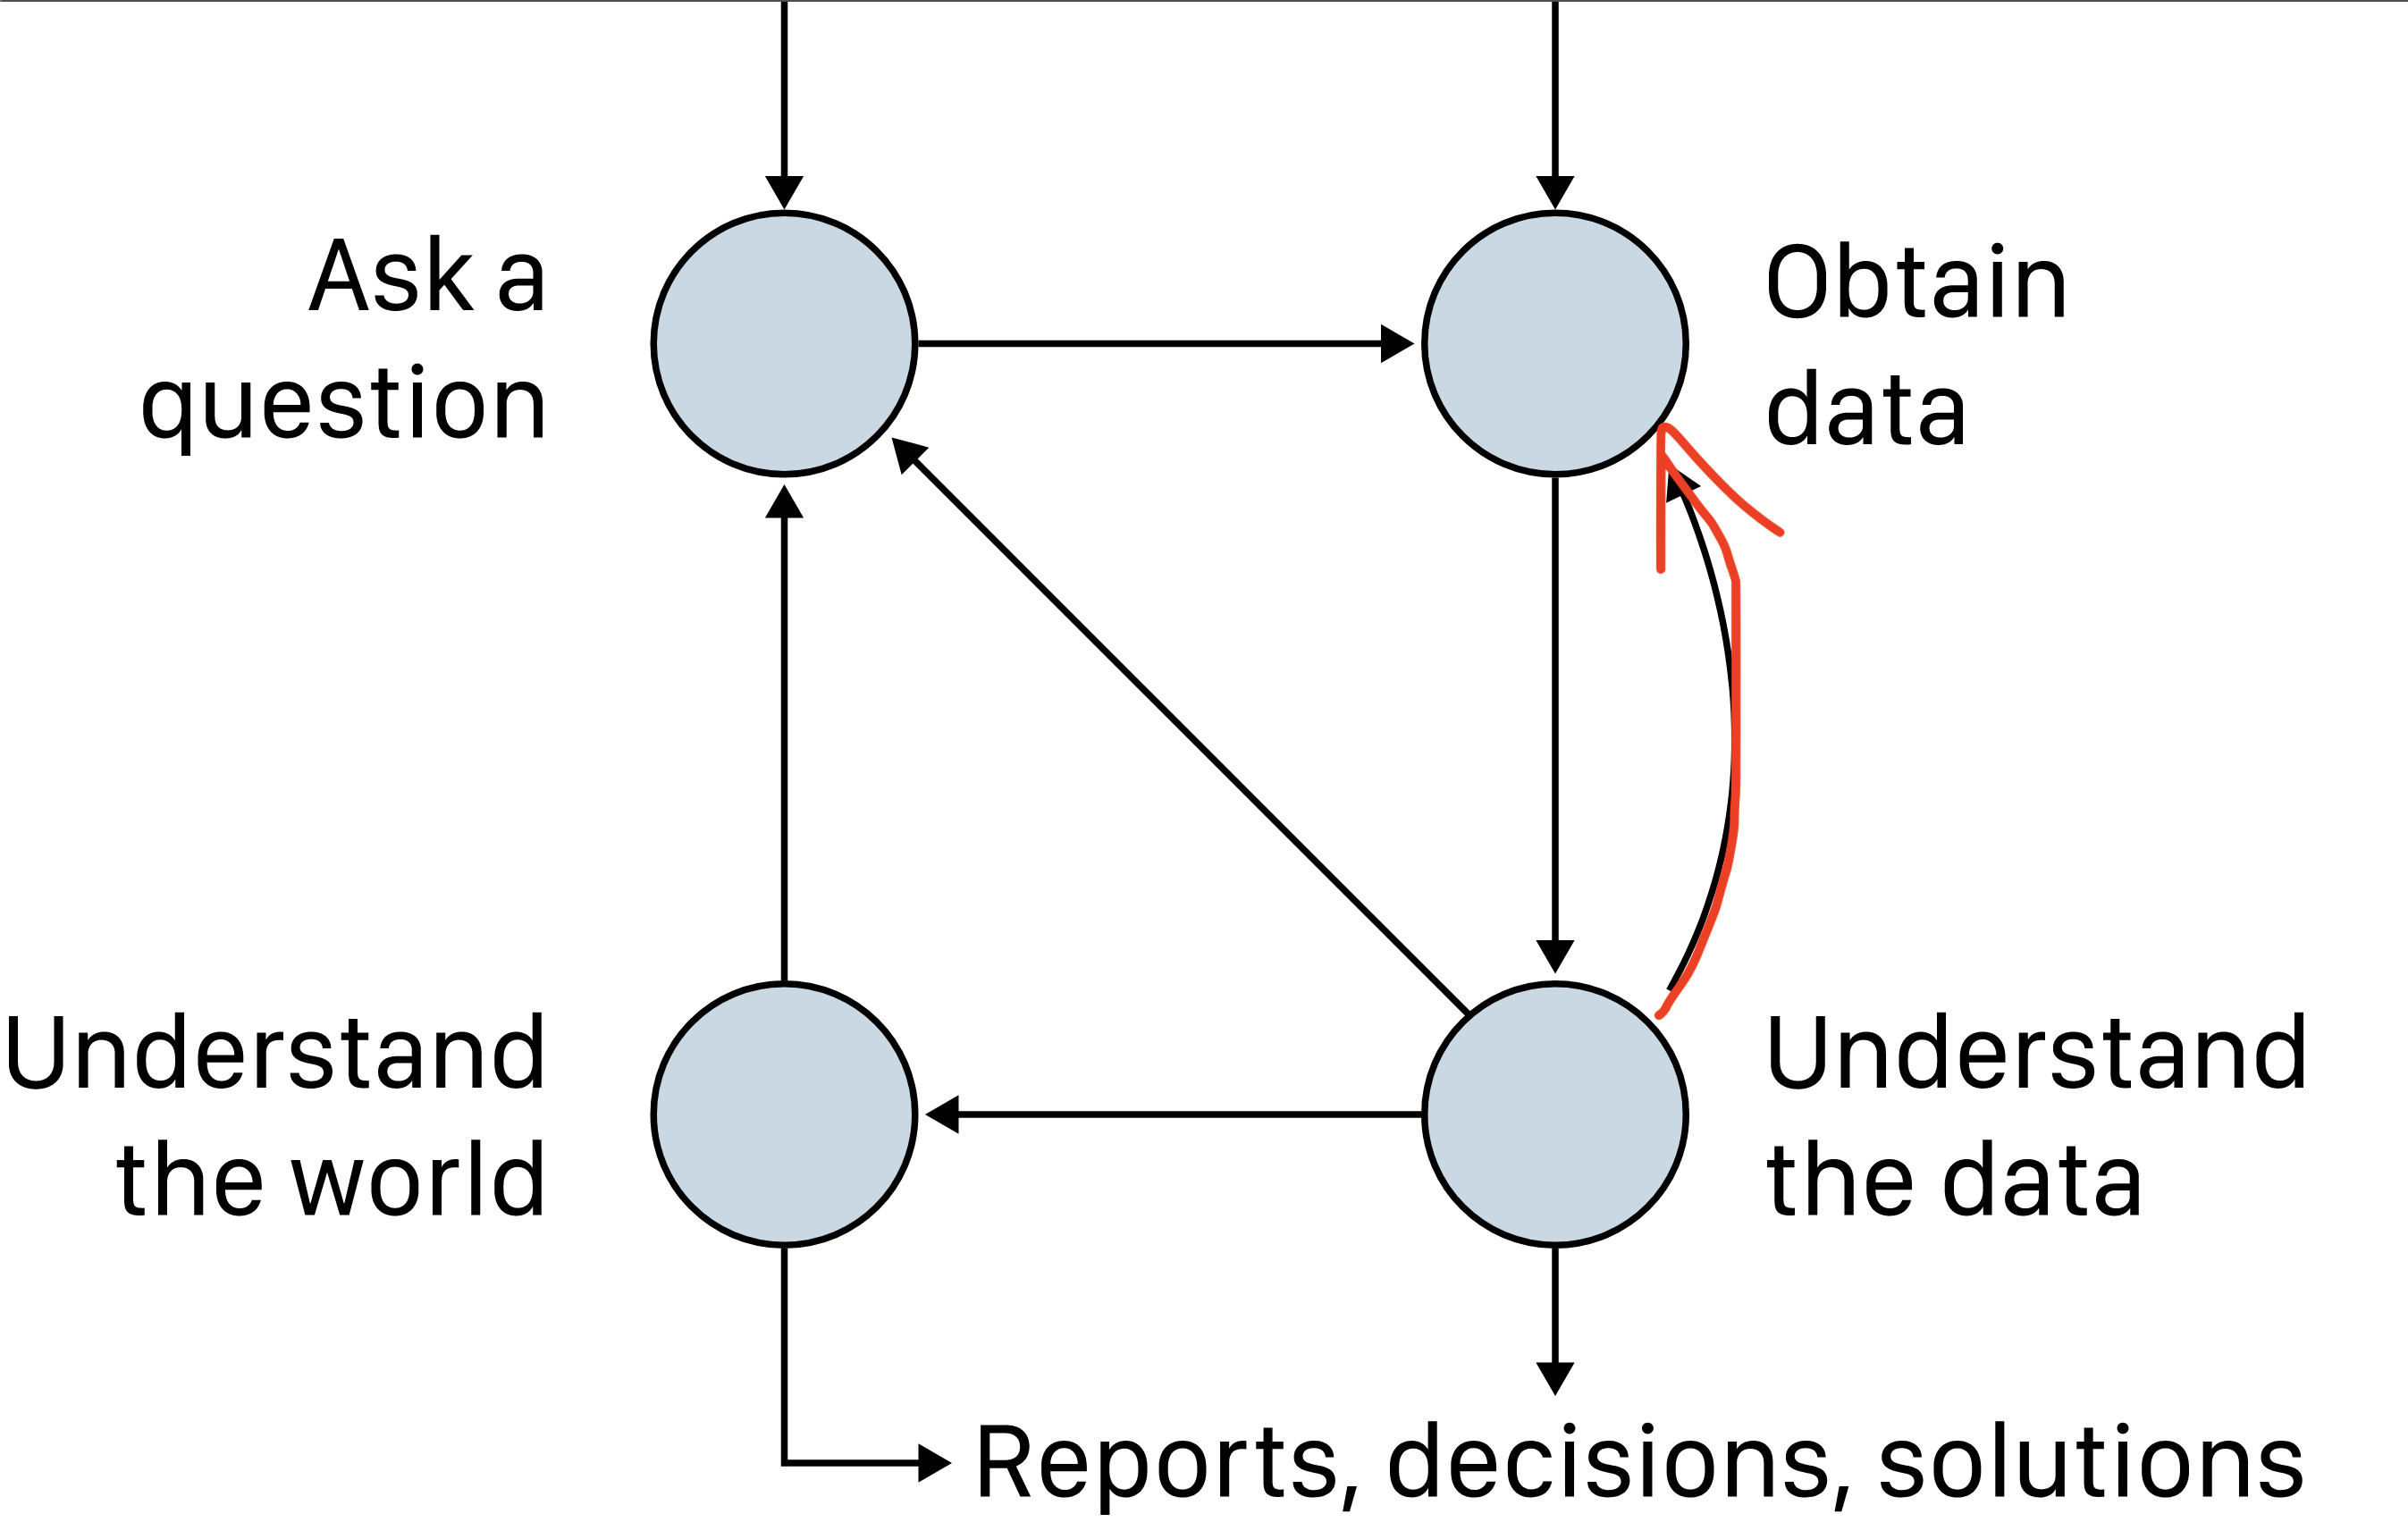
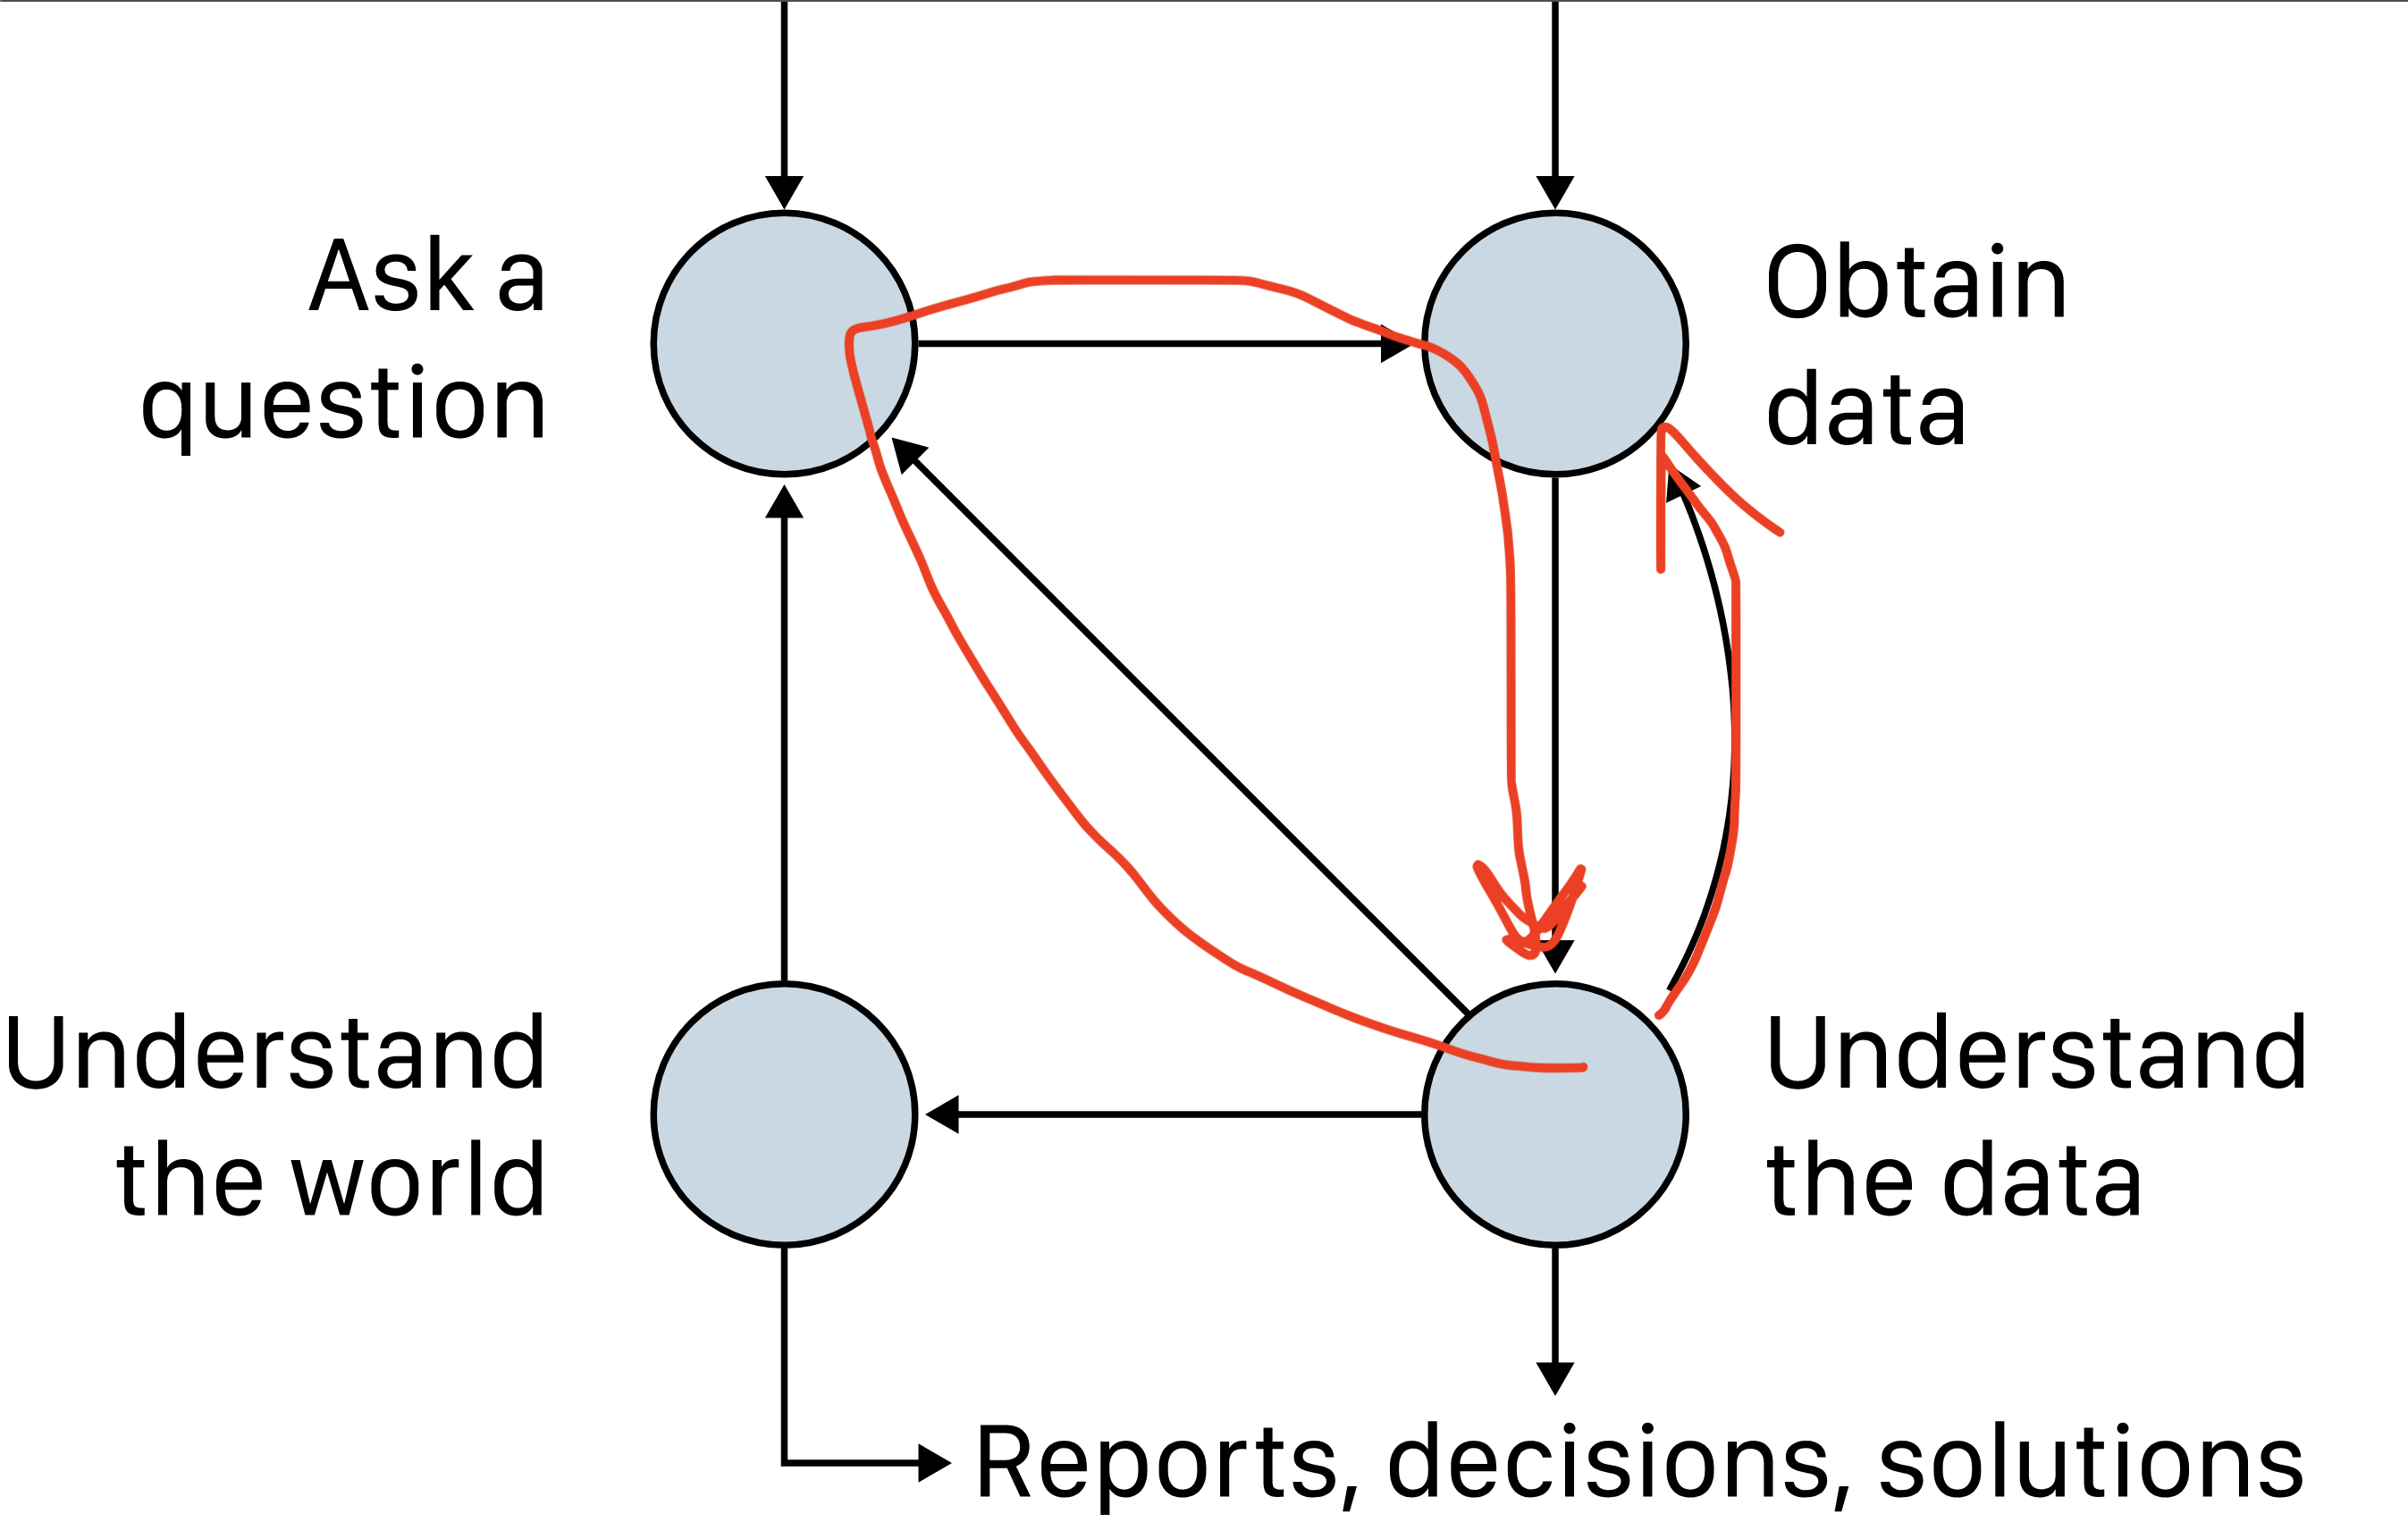
EDA is the process by which a data scientist explores a dataset in a systematic ways looking for patterns. The process is iterative, focused on the data, and generally involves:

  1. Asking questions about your data.
  2. Searching for answers using visualization, transformation, and modelling of your data.
  3. Using what you learn to refine your questions and/or generate new questions.

Plots to Communicate

  • Purpose
    • Question
    • Context
  • Composition
    • Graphic Design
    • Visual Cues and scales

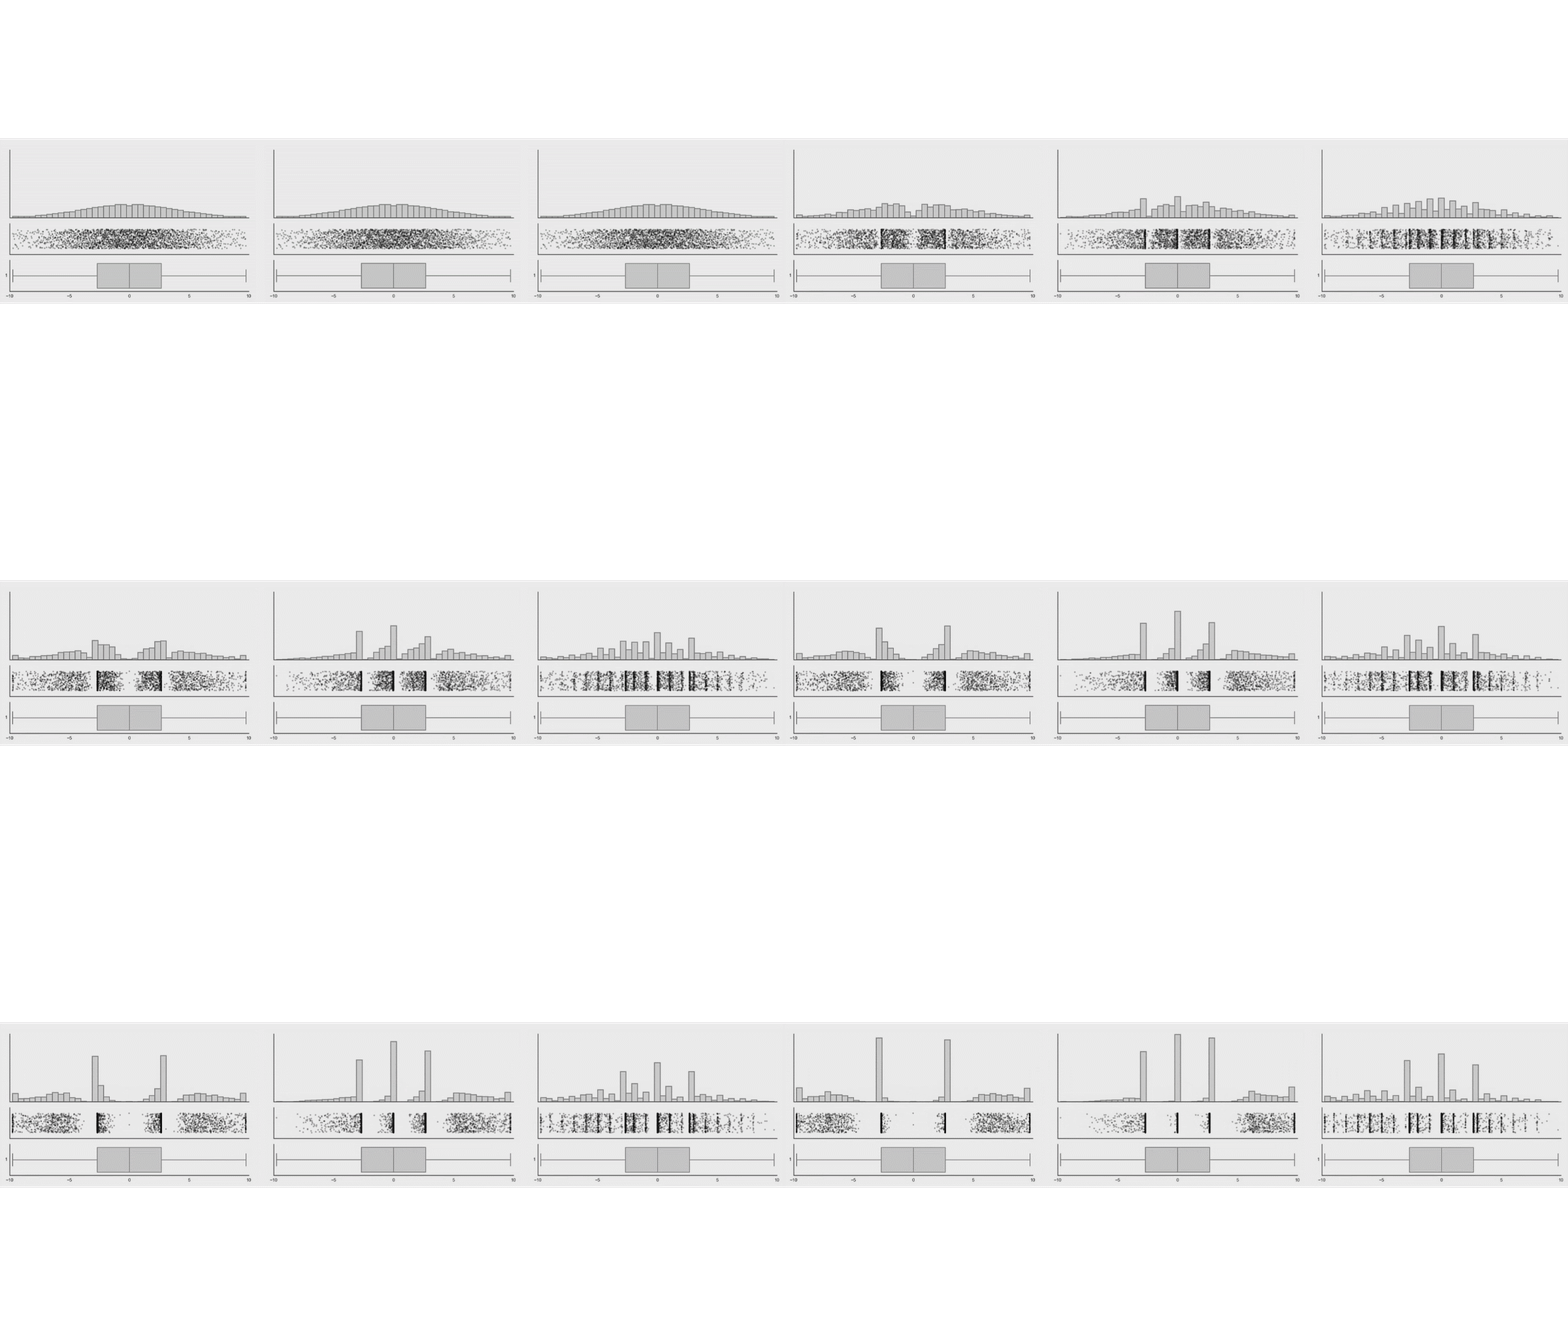
Analyzing Visualizations

Describe the design of each of the following visualizations.

Logistics

Quiz 1

  • Quizzes in general:
    • Last 20-30 minutes on Friday
    • Some weeks will be on paper, others on Moodle
    • This week: Moodle
  • Topics
    • Anything from CS 104/6/8 (since it’s a prerequisite)
    • Anything you’ve seen more than once so far (e.g., exercises, slides, reading, …)
  • Paper notes allowed
  • Memorization of syntax not required, but concepts behind the syntax are required

Other Assignments

  • Midterm Project first milestone posted this week, due next week
  • Exercise 1
  • Reading 3