Slides 7: Data Tidying and Visualizing
Logisics
- Reading: Part 2 of Wilke (ch 17-26) has a lot of useful stuff; also read “29 Telling a story and making a point”
Example Plot Redesign
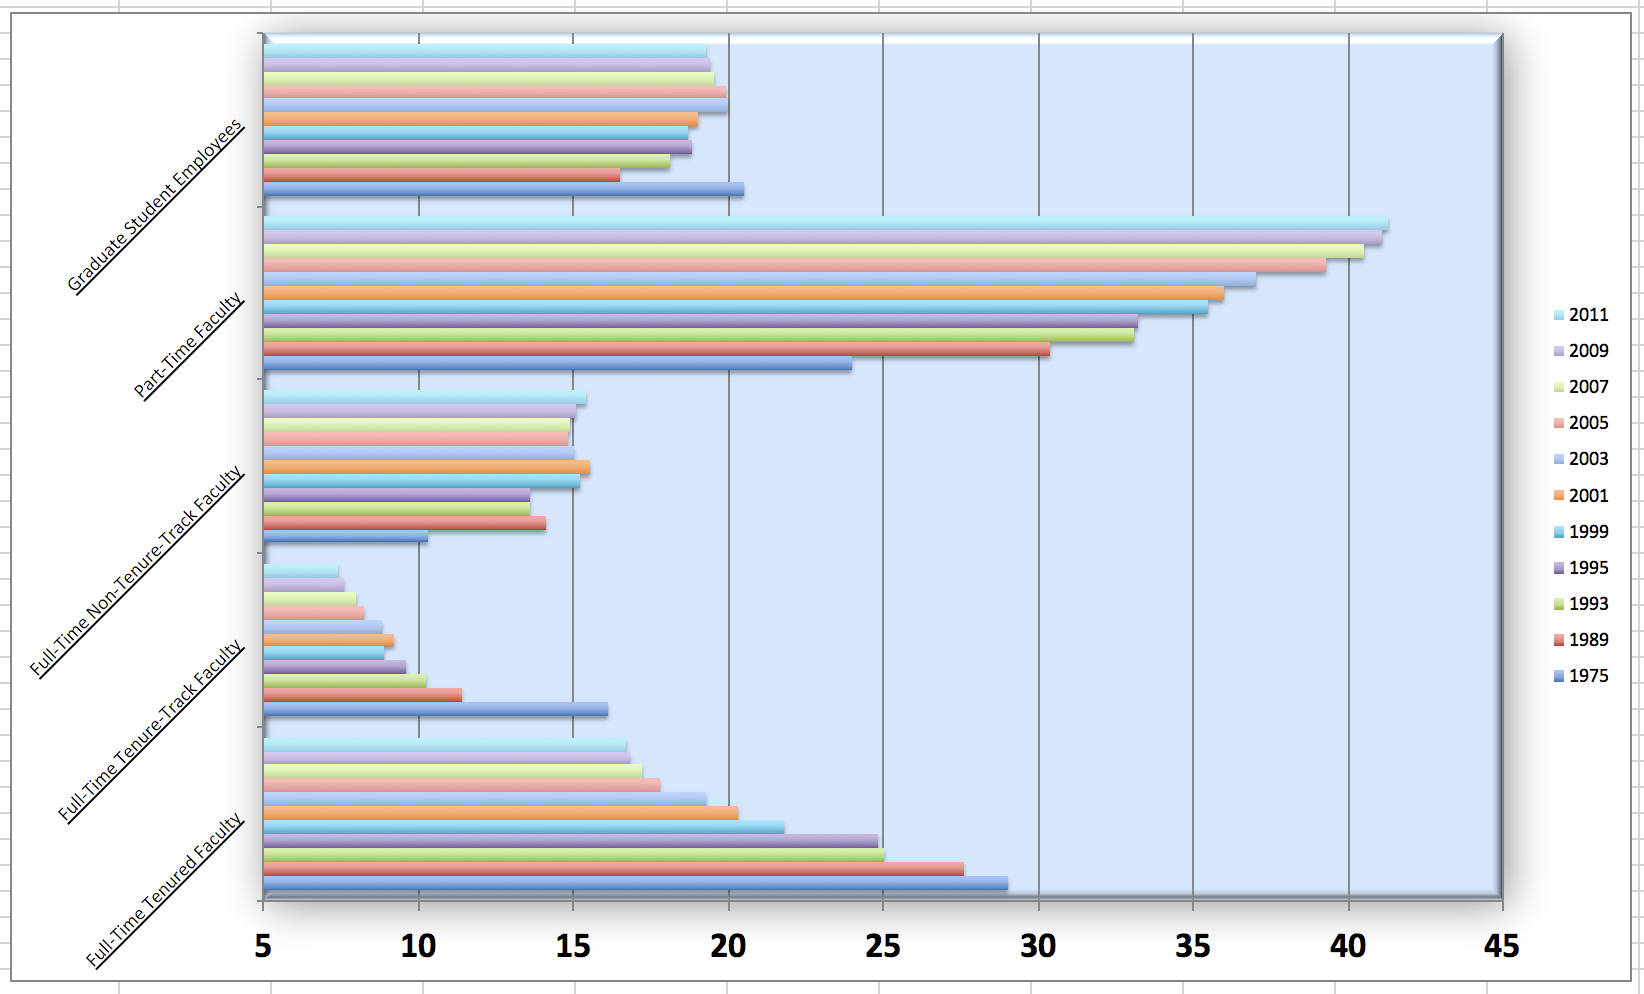
Instructional staff employment trends
- American Association of University Professors (AAUP)
- nonprofit association of academic professionals
- 2013 report: trends in instructional staff employees between 1975 and 2011
- contains an image very similar to this:
Data
Each row in this dataset represents a faculty type, and the columns are the years for which we have data. The values are percentage of hires of that type of faculty for each year.
| faculty_type | 1975 | 1989 | 1993 | 1995 | 1999 | 2001 | 2003 | 2005 | 2007 | 2009 | 2011 | |
|---|---|---|---|---|---|---|---|---|---|---|---|---|
| 0 | Full-Time Tenured Faculty | 29.0 | 27.6 | 25.0 | 24.8 | 21.8 | 20.3 | 19.3 | 17.8 | 17.2 | 16.8 | 16.7 |
| 1 | Full-Time Tenure-Track Faculty | 16.1 | 11.4 | 10.2 | 9.6 | 8.9 | 9.2 | 8.8 | 8.2 | 8.0 | 7.6 | 7.4 |
| 2 | Full-Time Non-Tenure-Track Faculty | 10.3 | 14.1 | 13.6 | 13.6 | 15.2 | 15.5 | 15.0 | 14.8 | 14.9 | 15.1 | 15.4 |
| 3 | Part-Time Faculty | 24.0 | 30.4 | 33.1 | 33.2 | 35.5 | 36.0 | 37.0 | 39.3 | 40.5 | 41.1 | 41.3 |
| 4 | Graduate Student Employees | 20.5 | 16.5 | 18.1 | 18.8 | 18.7 | 19.0 | 20.0 | 19.9 | 19.5 | 19.4 | 19.3 |
Recreate the visualization
What are the variables in this plot?
If the long data will have a row for each year/faculty type combination, and there are 5 faculty types and 11 years of data, how many rows will the data have?
Write the reshaping code
| faculty_type | 1975 | 1989 | 1993 | 1995 | 1999 | 2001 | 2003 | 2005 | 2007 | 2009 | 2011 | |
|---|---|---|---|---|---|---|---|---|---|---|---|---|
| 0 | Full-Time Tenured Faculty | 29.0 | 27.6 | 25.0 | 24.8 | 21.8 | 20.3 | 19.3 | 17.8 | 17.2 | 16.8 | 16.7 |
| 1 | Full-Time Tenure-Track Faculty | 16.1 | 11.4 | 10.2 | 9.6 | 8.9 | 9.2 | 8.8 | 8.2 | 8.0 | 7.6 | 7.4 |
| 2 | Full-Time Non-Tenure-Track Faculty | 10.3 | 14.1 | 13.6 | 13.6 | 15.2 | 15.5 | 15.0 | 14.8 | 14.9 | 15.1 | 15.4 |
| 3 | Part-Time Faculty | 24.0 | 30.4 | 33.1 | 33.2 | 35.5 | 36.0 | 37.0 | 39.3 | 40.5 | 41.1 | 41.3 |
| 4 | Graduate Student Employees | 20.5 | 16.5 | 18.1 | 18.8 | 18.7 | 19.0 | 20.0 | 19.9 | 19.5 | 19.4 | 19.3 |
Reshaping staff data
staff_long = staff.melt(
    id_vars=["faculty_type"],
    var_name="year",
    value_name="percentage"
)
staff_long| faculty_type | year | percentage | |
|---|---|---|---|
| 0 | Full-Time Tenured Faculty | 1975 | 29.0 |
| 1 | Full-Time Tenure-Track Faculty | 1975 | 16.1 |
| 2 | Full-Time Non-Tenure-Track Faculty | 1975 | 10.3 |
| 3 | Part-Time Faculty | 1975 | 24.0 |
| 4 | Graduate Student Employees | 1975 | 20.5 |
| 5 | Full-Time Tenured Faculty | 1989 | 27.6 |
| 6 | Full-Time Tenure-Track Faculty | 1989 | 11.4 |
| 7 | Full-Time Non-Tenure-Track Faculty | 1989 | 14.1 |
| 8 | Part-Time Faculty | 1989 | 30.4 |
| 9 | Graduate Student Employees | 1989 | 16.5 |
| 10 | Full-Time Tenured Faculty | 1993 | 25.0 |
| 11 | Full-Time Tenure-Track Faculty | 1993 | 10.2 |
| 12 | Full-Time Non-Tenure-Track Faculty | 1993 | 13.6 |
| 13 | Part-Time Faculty | 1993 | 33.1 |
| 14 | Graduate Student Employees | 1993 | 18.1 |
| 15 | Full-Time Tenured Faculty | 1995 | 24.8 |
| 16 | Full-Time Tenure-Track Faculty | 1995 | 9.6 |
| 17 | Full-Time Non-Tenure-Track Faculty | 1995 | 13.6 |
| 18 | Part-Time Faculty | 1995 | 33.2 |
| 19 | Graduate Student Employees | 1995 | 18.8 |
| 20 | Full-Time Tenured Faculty | 1999 | 21.8 |
| 21 | Full-Time Tenure-Track Faculty | 1999 | 8.9 |
| 22 | Full-Time Non-Tenure-Track Faculty | 1999 | 15.2 |
| 23 | Part-Time Faculty | 1999 | 35.5 |
| 24 | Graduate Student Employees | 1999 | 18.7 |
| 25 | Full-Time Tenured Faculty | 2001 | 20.3 |
| 26 | Full-Time Tenure-Track Faculty | 2001 | 9.2 |
| 27 | Full-Time Non-Tenure-Track Faculty | 2001 | 15.5 |
| 28 | Part-Time Faculty | 2001 | 36.0 |
| 29 | Graduate Student Employees | 2001 | 19.0 |
| 30 | Full-Time Tenured Faculty | 2003 | 19.3 |
| 31 | Full-Time Tenure-Track Faculty | 2003 | 8.8 |
| 32 | Full-Time Non-Tenure-Track Faculty | 2003 | 15.0 |
| 33 | Part-Time Faculty | 2003 | 37.0 |
| 34 | Graduate Student Employees | 2003 | 20.0 |
| 35 | Full-Time Tenured Faculty | 2005 | 17.8 |
| 36 | Full-Time Tenure-Track Faculty | 2005 | 8.2 |
| 37 | Full-Time Non-Tenure-Track Faculty | 2005 | 14.8 |
| 38 | Part-Time Faculty | 2005 | 39.3 |
| 39 | Graduate Student Employees | 2005 | 19.9 |
| 40 | Full-Time Tenured Faculty | 2007 | 17.2 |
| 41 | Full-Time Tenure-Track Faculty | 2007 | 8.0 |
| 42 | Full-Time Non-Tenure-Track Faculty | 2007 | 14.9 |
| 43 | Part-Time Faculty | 2007 | 40.5 |
| 44 | Graduate Student Employees | 2007 | 19.5 |
| 45 | Full-Time Tenured Faculty | 2009 | 16.8 |
| 46 | Full-Time Tenure-Track Faculty | 2009 | 7.6 |
| 47 | Full-Time Non-Tenure-Track Faculty | 2009 | 15.1 |
| 48 | Part-Time Faculty | 2009 | 41.1 |
| 49 | Graduate Student Employees | 2009 | 19.4 |
| 50 | Full-Time Tenured Faculty | 2011 | 16.7 |
| 51 | Full-Time Tenure-Track Faculty | 2011 | 7.4 |
| 52 | Full-Time Non-Tenure-Track Faculty | 2011 | 15.4 |
| 53 | Part-Time Faculty | 2011 | 41.3 |
| 54 | Graduate Student Employees | 2011 | 19.3 |
Why does that say “sum of percentage”?
- Which trends are easiest to see? (Can you see a trend in any combination of faculty types?)
- What would you improve?
Try a different plot type
Hm, what’s going on here?
Numeric!
<class 'pandas.core.frame.DataFrame'>
RangeIndex: 55 entries, 0 to 54
Data columns (total 3 columns):
 #   Column        Non-Null Count  Dtype
---  ------        --------------  -----
 0   faculty_type  55 non-null     object
 1   year          55 non-null     object
 2   percentage    55 non-null     float64
dtypes: float64(1), object(2)
memory usage: 1.4+ KBarray(['1975', '1989', '1993', '1995', '1999', '2001', '2003', '2005',
'2007', '2009', '2011'], dtype=object)Year was a string because it was a column name of the CSV.
Improved line plot
px.line(
    staff_long,
    x="year", y="percentage", color="faculty_type",
    markers=True,
    labels={"year": "Year", "percentage": "Percentage of hires", "faculty_type": "Faculty type"}
)