Wrap-Up

Today

  • Please fill out Course evaluations
    • It’s helpful data for me, my department, and the university.
    • Each comment matters. Each rating matters.
    • Be honest, be balanced. Include both things to keep and things to change.
  • Communication Tips
  • Missing Data, Time Series
  • Virtuous Data Science: wrap-up

Logistics

  • Sign up for final project presentation slot (see Moodle)
    • Make the title a link to your slides
    • Lab is busy, so: North Hall 253
  • All work should be in before Finals (or make specific arrangements with me)
  • Moodle grades aren’t yet accurate, but hopefully soon!

Communication

Key points

  • Consider the audience to get the level of detail right.
    • Never assume your audience can rapidly process complex visuals. (Claus Wilke)
  • Consider the purpose to choose report vs dashboard vs presentation
  • Anchor claims in data.
  • Tell stories (e.g., “but-therefore”)

Make a point

Report A

MAIN POINT

  • Supporting chart 1
  • Supporting table 2
  • Supporting model 3

Discussion about how each supports main point

Report B

  • Chart 1
  • Table 2
  • Model 3
  • Chart 4
  • Table 5
  • Chart 6
  • Model 7
  • Chart 12
  • Table 25

Tell a Story

  • Chart 1
  • Therefore, chart 2
  • BUT, chart 3

but-therefore

See also: “Telling a story and making a point

Anchor conclusions in data

  • The units are probably seconds

  • The fit looks good

  • This was surprising
  • because the median, 600, would be 10 minutes
  • because the mean error of $15 is less than 0.1% of the price
  • because I expected that people would leave higher ratings on products they enjoyed more

Use appropriate language

Plain language for the overview, conclusion, and visuals.

  • Labels in visuals: use real names, not code_names. (For all variables, not just x and y.)
  • Don’t assume the reader knows the structure of the data.

Technical language when describing methods (data acquisition, wrangling, modeling, etc.).

  • What data representation choices did you make? why?
  • What modeling choices? Why? etc.

Brief Notes

Missing Data

  • Missingness is often informative.
    • e.g., “I don’t want to answer that question.”
    • e.g., “Only people who have a certain condition are asked this question.”
    • So you might want to add a column: df['f1_missing'] = df['f1'].isna()
  • Never blindly drop rows with missing data
    • At least count how many you’re dropping.

Time Series

  • “Forecasting” could be a whole course (e.g., “Forecasting Principles and Practice”)
  • Some approaches
    • Naive: Predict that the last sample continues
    • Trend: Predict that a (linear) trend continues
    • Seasonal: Predict the same value as this time last year
    • fancier methods: Moving average, exponential smoothing, ARIMA, …

See Time-related feature engineering from scikit-learn documentation

Lagged (Shifted) Features

A simple approach to time series prediction is to shift the target variable by one time step and use it as a feature.

from sklearn.datasets import fetch_openml

bike_sharing = fetch_openml(
    "Bike_Sharing_Demand", version=2, as_frame=True, parser="pandas"
)
df = bike_sharing.frame
df.head()
season year month hour holiday weekday workingday weather temp feel_temp humidity windspeed count
0 spring 0 1 0 False 6 False clear 9.84 14.395 0.81 0.0 16
1 spring 0 1 1 False 6 False clear 9.02 13.635 0.80 0.0 40
2 spring 0 1 2 False 6 False clear 9.02 13.635 0.80 0.0 32
3 spring 0 1 3 False 6 False clear 9.84 14.395 0.75 0.0 13
4 spring 0 1 4 False 6 False clear 9.84 14.395 0.75 0.0 1
target_var = "count"
df['prev_count'] = df[target_var].shift(1)
df[['prev_count', target_var]].head()
prev_count count
0 NaN 16
1 16.0 40
2 40.0 32
3 32.0 13
4 13.0 1

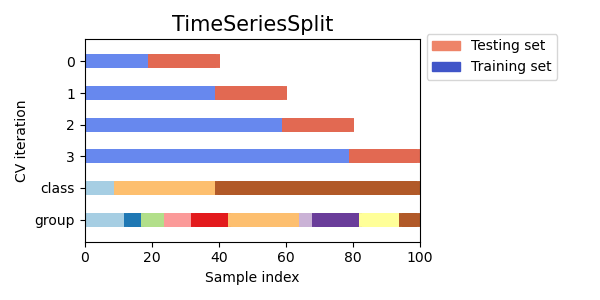
Time-Series Validation

  • Don’t randomly split your data into train/test sets.
  • Do split your data into train/test sets by time.
    • e.g., train on the first year, test on the second year
  • More general approach: time series cross-validation

Wrap-Up of Virtuous Data Science

What virtues have we practiced in this course? What virtues should data scientists have?

Virtues

  • Cardinal Virtues
    • Prudence
    • Justice
    • Temperance
    • Courage
  • Theological Virtues
    • Faith
    • Hope
    • Love

Vices

  • Pride
  • Greed
  • Lust
  • Envy
  • Gluttony
  • Wrath
  • Sloth

Ethics

Not just moral dilemmas; we make ethical choices constantly.

  • Normative / deontological: “is this right?”
  • Situational: “is this promiting what is good?”
  • Virtuous: “How does a good person act? How do I become a good person?”

Objectives

  • Describe how Reformed concepts of justice and shalom apply to data collection, analysis, sharing, and use.
  • Give examples of specific concerns around privacy, bias, accountability, and transparency
  • Describe steps and dispositions that individual data scientists can take to act justly in their profession

A bullet-point summary of biblical justice

  • Community above individual (voluntarily)
  • Equity: equal treatment, dignity
  • Collective responsibility
  • Individual responsibility
  • Advocacy for poor and marginalized

What does biblical justice require, in the area of data science?

Community

The righteous are willing to disadvantage themselves to advantage the community; the wicked are willing to disadvantage the community to advantage themselves.

So:

  • privacy: what must we share? what must we not share?
  • integrity in data collection, analysis, reporting, communication

Thus:

  • Data analysis process: reproducible, transparent, documented
  • Reporting: transparency about limitations, choices, consideration of possible harms

Equity

Everyone must be treated equally and with dignity.

. . .

  • direct impact
    • fair risk assessment (see Discussion and COMPAS)
    • fair surveillance (don’t hyper-surveil the poor etc.)
    • fair resource allocation
  • indirect impact:
    • don’t show ads for criminal background checks more often for Black names
    • don’t tolerate higher speech recognition error rates for minorities
    • show a representative diversity of age/gender/race/… in image searches

Should we even be predicting peoples’ lives?

  • Risk assessment for criminality, loan approval, etc. requires predicting peoples’ future actions and situations
  • These predictions might be terribly inaccurate. Should we be trying at all?

Read more: When is automated decision making legitimate?

Despite using a rich dataset and applying machine-learning methods optimized for prediction, the best predictions were not very accurate and were only slightly better than those from a simple benchmark model.

Corporate responsibility: I am sometimes responsible for and involved in other people’s sins.

  • Even if I intend no prejudice, my algorithm could be prejudiced because of training data.
  • Even if my work is honest, I could be supporting a company that exploits other workers directly or rely on conflict minerals and child labor
  • Environmental responsibility is both individual and collective

Individual responsibility: I am finally responsible for all my sins, but not for all my outcomes.

  • I must do what’s right, whether or not my company’s policies require it.
  • When something isn’t right, I need to say something even if it risks my job.

Advocacy: We must have special concern for the poor and the marginalized.

  • By exposing injustice through visualization and modeling
  • By listening to and amplifying, not speaking for.
  • e.g., beware of doing “parachute research” or de-contextualized “Data for Good”

Data science, and data scientists, are not saviors.

Incarnation

In your relationships with one another, have the
    same mindset as Christ Jesus:
Who, being in very nature God,
    did not consider equality with God something
      to be used to his own advantage;
rather, he made himself nothing
    by taking the very nature of a servant,
    being made in human likeness.
And being found in appearance as a man,
    he humbled himself
    by becoming obedient to death—
        even death on a cross!

Philippians 2:5-8, NIV

Learning More

Courses

  • DATA 304: Visualization
  • DATA 385: Topics in Data Science (varies; 24SP is “Cause and Design”)
  • CS 375 / 376: Machine Learning I/II
  • STAT 245: Applied Data Analysis
  • STAT 341: Computational Bayesian Statistics

Some further reading on data ethics

Other resources on Data Ethics

Who/What I’m Reading / Following: Tech

“What can I do?”

  • Practice the “data dispositions”
    • Humility (cite sources, acknowledge limitations, validate results)
    • Integrity (check assumptions, reproduce analyses, evaluate others’ claims)
    • Hospitality (clear visuals, clear reports, clear code)
    • Compassion and justice
  • Listen a lot. To diverse opinions. (e.g., “The Flip Side”)
  • Keep in touch.