Final Project
Final Project: A complete Data Science process
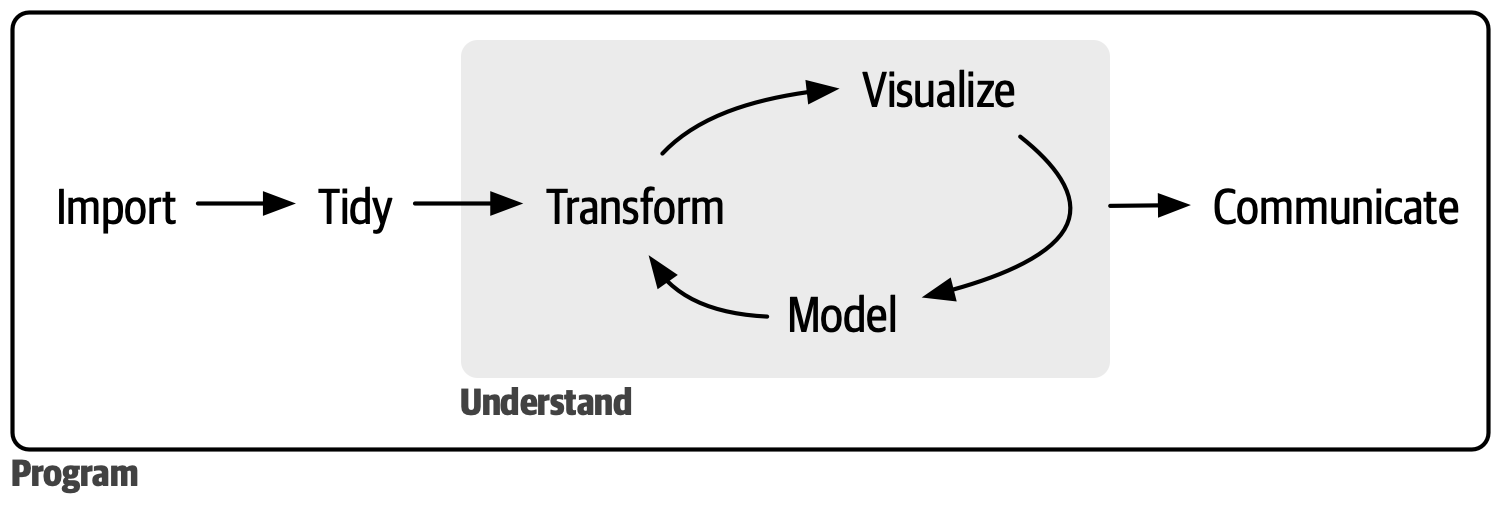
The goal of this project is to practice a complete data science workflow: question, data, exploration, modeling, and communication. Results will be presented as a report, supporting code, and a brief presentation to the class. Successful outcomes should include visual, analytical, and perspectival components. The report should be at the level of polish and formality of a blog post (more than a class homework assignment, less than an academic paper). The overview and primary visualizations should be intelligible to a non-technical audience; the methods should be described in precise technical language as appropriate.
An important component of this project is a comparative critique of some related prior work. That is, you are not simply demonstrating that you can perform an analysis, but also that you can evaluate the strengths and weaknesses of others’ analyses. This may be the most important take-away from this class for your future career.
Logistics
Teams: Both individual and team projects are permitted, with a mild encouragement towards teams.
Presentations: The final course meeting (during the designated final exam period) will be devoted to final project presentations. Feedback on others’ projects will be part of your final project grade, so attendance is mandatory.
There are two sections of this class, thus two sessions of final project presentations. Refer to the Calvin exam schedule for the official dates; for 2023, it’s Saturday Dec. 9 at 1:30 p.m. and Monday Dec. 11 at 1:30 p.m.. Your team must choose which to present at. You are welcome to attend both sessions to see everyone’s work.
Presentation Logistics
Presentations are the “movie trailer” for your report—they should be short, engaging, and give the audience a sense of what you did and why it matters.
Length: Max of 10 minutes per team (ideally under 5 minutes). Practice at least once beforehand so your presentation is efficient.
Make sure you include:
- What problem you’re trying to solve (and why it matters)
- What the data looks like (granularity, an example row)
- What your model looks like (features, target, maybe an example prediction that it makes)
- Results (headlines only)
- Conclusion (have you solved the problem?) and any limitations
Don’t include:
- Every detail (save that for the report)
- Code screenshots (unless it’s particularly clever); explain what you’re doing in English
- Data screenshots (export a table instead)
- Console output screenshots (make a table instead, or better, a chart)
Scrolling through a rendered report is only okay if you have practiced so you can highlight what’s important and not get lost in the details.
Each student should give at least one constructive suggestion or insightful question for other presentations.
Milestones
- Milestone 1: Initial proposal. This should include:
- A tentative topic (kind of data you want to work with, question you’d like to ask). Include a brief description of what drives your interest in it.
- An example or two of some data science work you’ve found on the topic already. See below for some guidance on this. Include the URLs of resources you found, and some brief commentary about each one (does it seem good?)
- A proposal of what you’d like to do. A first step will usually be to do an analysis similar to one of the examples you found, and you may not have much idea beyond that at this time. But if you do have some ideas for what you might want to do differently, this is a good place to include them. Note that your overall task should include some modeling (predictive or otherwise).
- Tentative Teams: If you have already found people who may be interested in working with you, note that here.
- Milestone 2: Dataset, exploratory visualization, and summary of prior work
- You should have the EDA section of your report complete, and a good start on everything before that.
- Milestone 3: Initial modeling and visualization
- Milestone 4: Final report
Choosing a project and examples
You can find examples of data science work on sites like Kaggle, TowardsDataScience, Reddit, YouTube, and GitHub. Also check out the TidyTuesday project and r-bloggers.
Your project should include some modeling, so it should involve more than making visualizations. Predictive modeling is closest to the emphasis of this class, but other kinds of modeling (such as clustering) are often ok.
Your data should be rich enough to support the kind of modeling you want to do, but not too complex to work with. For example, avoid any dataset larger than 500 MB since it probably won’t fit. Also, avoid image and sound data for similar reasons. (Although if you really want to work with images, there are ways to do this.)
Some types of projects that have worked well in the past:
- Participating in a Kaggle competition. It should be a competition that is still open. You don’t need to win, but you should be able to do better than the baseline. You should also do some EDA and/or visualization beyond what’s already been done by others.
- Reproducing a published analysis. Find a published analysis that you can reproduce, and then extend it in some way. For example, you might find a published analysis that uses a dataset you can’t access, and then find a similar dataset that you can access. Or you might find a published analysis that uses a dataset you can access, and then extend it in some way (e.g., by adding a new feature, or by using a different model).
Some projects that could work great, but should be discussed with the instructor first:
- Redoing some class activities using a different toolkit. For example, what if this class were to be taught in JavaScript using ObservableHQ? (Talk with Prof Arnold for detailed ideas.)
- Exploring interpretable models. There are some new types of models coming out that are more interpretable, but we have not gotten to discuss them much in class. Perhaps you could explore one of these models and compare it to a more traditional model.
- Working with a large language model. For example, could you give ChatGPT some example rows from your dataset, then ask it to write a decision tree for you, and evaluate the result? There are losts of
Detailed Expectations
NOTES:
- You will likely need to make some choices regarding what variables to include, whether to do some pre-processing (e.g., addressing missing values, generating new variables), etc. Clearly state:
- What decisions you made
- Why you made them
- What might have been alternative choices.
- Tell the “rational reconstruction” of the story of how the analysis was done.
- Don’t give the play-by-play of everything you tried, every idea you had, etc., but…
- Do include things you tried that led to an important observation later on.
- If you use any code from the Internet, you should acknowledge its source and provide a link.
- You should submit all of the code needed to replicate your results, but your report should be understandable without looking at the code.
- You’ll submit both slides and a report. See the Midterm project for submission instructions.
Your report should include the following general elements (though treat this specific outline as a suggestion only; certain reports will need to deviate from this structure in small or large part):
- A succinct but descriptive title
- Overview
- A real-world question that you’d like to explore, and why it’s interesting.
- This question should be stated in language that is understandable to someone who hasn’t studied data science and doesn’t know the details of your dataset.
- The best questions include motivation from prior literature that gives, for example, some pattern or relationship that you’d expect to find and why.
- A brief (2-4 sentences) high-level description of the dataset: what is the dataset about? Where did it come from? What sort of data does it contain?
- A real-world question that you’d like to explore, and why it’s interesting.
- Prior Work
- A summary of what you have found that others have done with your data or question. Include URLs and author names.
- A response to their work:
- What did they do well that is inspiring?
- What could they improve on or explore further?
- Do you trust their results? Why or why not?
- In what ways do you intend for this project to extend or enhance that prior work? (Save the details of how for the Approach section.)
- Approach
- A problem description or specific question
- This question should be stated in more specific technical terms than the real-world question.
- It should reference the particular features of your dataset.
- This question ideally helps answer the real-world question, but it’s okay if it doesn’t.
- The approach that you’ll take to answer that question, probably using some sort of predictive or statistical modeling.
- A description of the data’s provenance: as much as you can, trace the path from the events or measurements all the way to the dataset you’re working with. You might answer:
- where did the data come from originally?
- Where did you download it from? As much as you can tell or speculate, how did it end up available there?
- The number of records (rows) in the dataset, and what each one represents.
- Give an example of some part of the data in your dataset.
- Consider writing a simple sentence that conveys the information in the first row, as an example.
- A list of the features in the dataset and their types.
- An analysis of the appropriateness of your dataset for your approach. (What’s good about it? What do you wish were better?)
- This section should also discuss the overall approach of any basic data wrangling needed to get the data into an overall usable form. More specific wrangling may be needed for constructing plots or models later.
- A problem description or specific question
- Exploratory Data Analysis (EDA)
- Show plots or tables illustrating the distribution of at least two variables in your dataset. Comment on anything interesting you observe.
- Show plots illustrating bivariate relationships for at least 2 pairs of variables. Comment on anything interesting you observe (e.g., strength of relationship, dependence on other factors).
- Summarize your EDA findings: how do your observations inform the modeling?
- Modeling
- This section is written for predictive modeling; if you’re doing inferential modeling or clustering, adapt this section as needed.
- Describe the modeling setup. Clearly state at least:
- what is the target variable you are trying to predict
- which variables (features) you are using to predict it, and why you chose those features
- how you will measure accuracy (can you give meaningful units?)
- what validation method did you choose and why
- Fit a basic predictive model using one of the techniques we discussed in class (e.g., Decision Trees, Linear/Logistic Regression, Random Forest)
- Describe why you chose that model (and its features and any hyperparameters)
- Describe what kind of performance you expect from it
- Report the results of your basic predictive model via cross-validation.
- Make one or more changes to the predictive model to (attempt to) improve the accuracy. Discuss what changes you made, why you made them, and what the results were.
- The strongest reports will include insightful visualizations of the model, its predictions, and/or its mistakes, and a discussion of what those plots tell us.
- Report on the final accuracy of your best model on the test set, if applicable.
- Alternative: instead of a supervised prediction task, you can define an unsupervised learning task and use clustering. In this case, clearly state what you want to understand through the clustering, and report your observations.
- Findings: Summarize the analyses you performed and what the results told you. What do your findings say about the real-world and prediction (or clustering) questions you posed?
- Limitations: What are some limitations of your analyses? Did you notice any potential biases in the data you used or analysis you did? Any other ethical questions raised during this project?
- Future Directions: What new questions came up following your exploration of this data? Identify at least one question that would require new data or a new analysis approach, and specify what steps would be required.
You might additionally walk through what the model predicts, and how it does it, for one or two specific examples, ideally ones that aren’t even part of your dataset.
Report Template
This template includes a suggested outline for your report. You may choose to organize your report differently..
---
title: "YOUR PROJECT TITLE HERE"
author:
    - "Your name"
    - "Partner name"
format:
  html:
    embed-resources: true
    code-tools: true
    code-fold: true
---

## Overview

### Question

### Summary of Findings

## Prior Work

### Summary and critique of prior work

Ideally this section compares two different prior analyses on similar topics.

### How this project extends prior work

## Approach

### Problem Description

### Data

#### Provenance

#### Structure

#### Appropriateness for task

### Modeling Question and Approach


## Exploratory Data Analysis

### Individual Variables

### Combinations of Variables


## Modeling


## Summary

### Discussion of Findings

This section should compare two different approaches (models, representation choices, evaluation methods, or whatever you have chosen).

### Limitations and Social / Ethical Considerations

### Future Directions
(Project descriptions originally thanks to Ofra Amir)